We found it in Baltimore’s banking system. It’s in our houses and even in our children’s blood.
Racial segregation in Baltimore continues to define the city, an analysis of nearly every data set The Baltimore Banner data team analyzed in our first year has found.
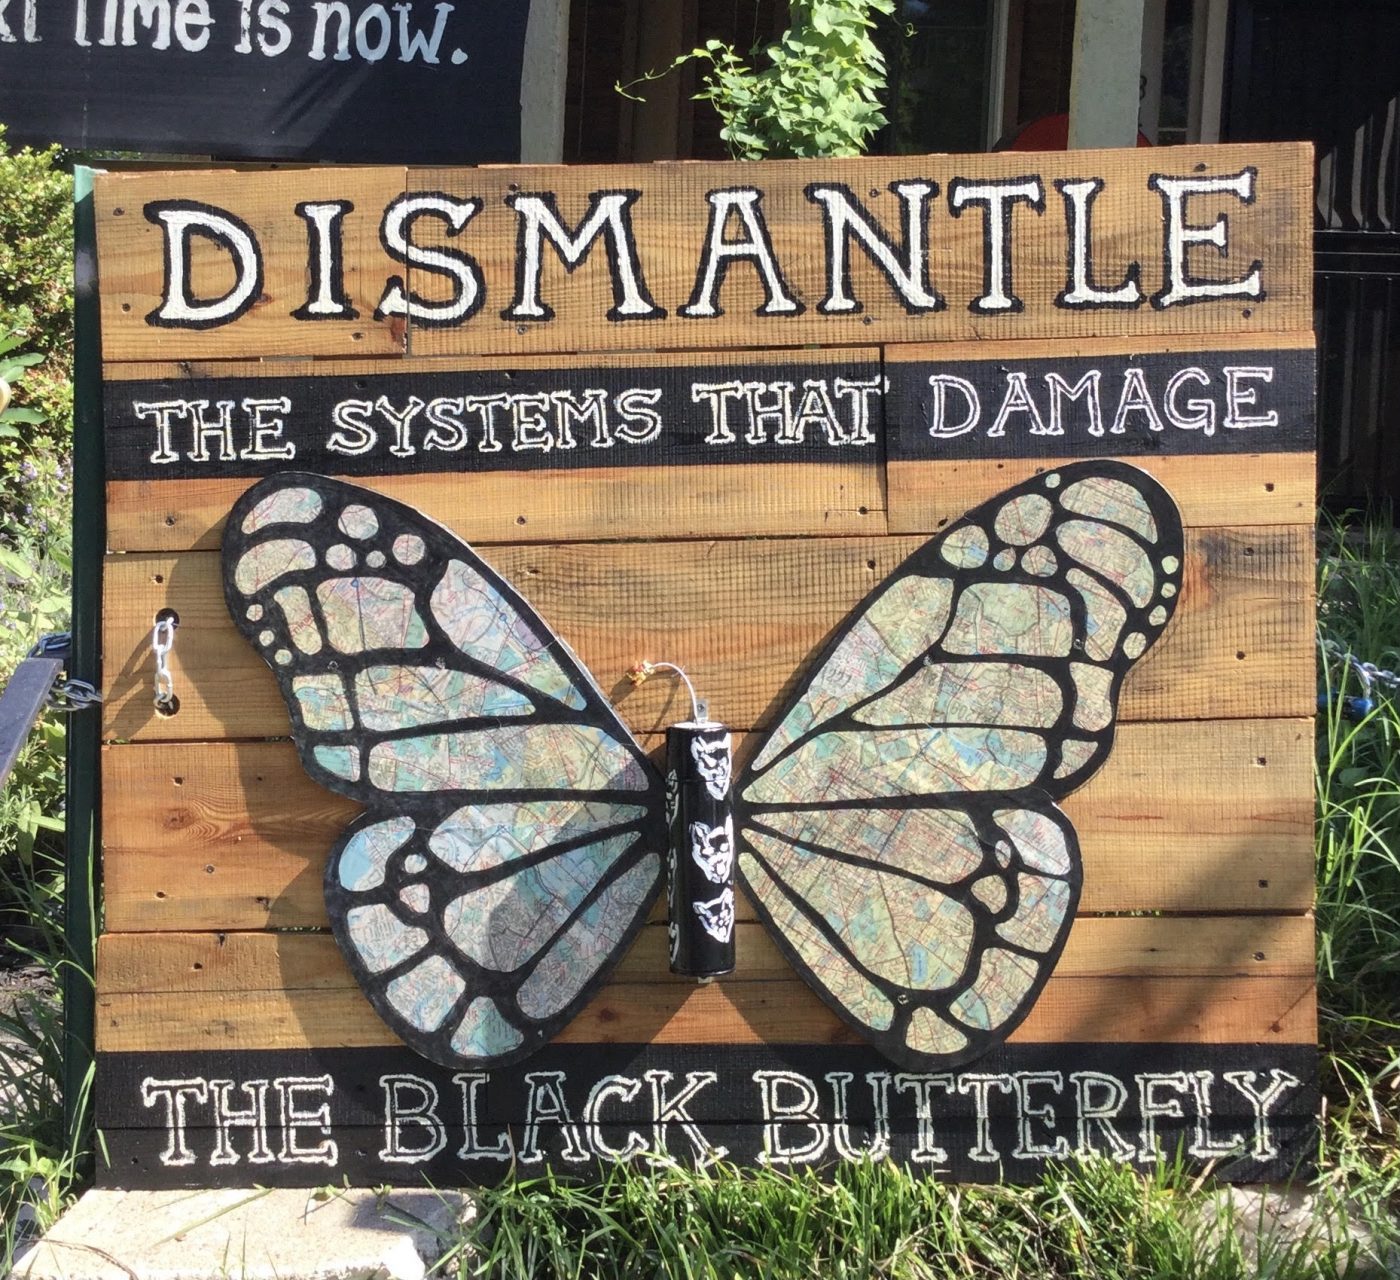
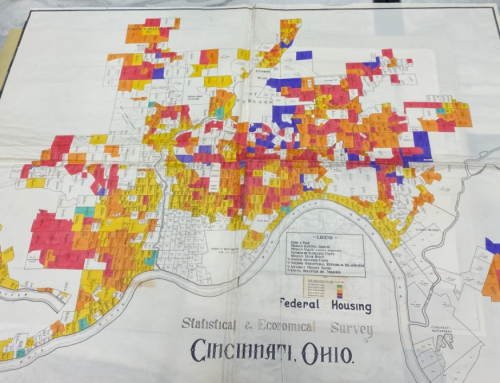
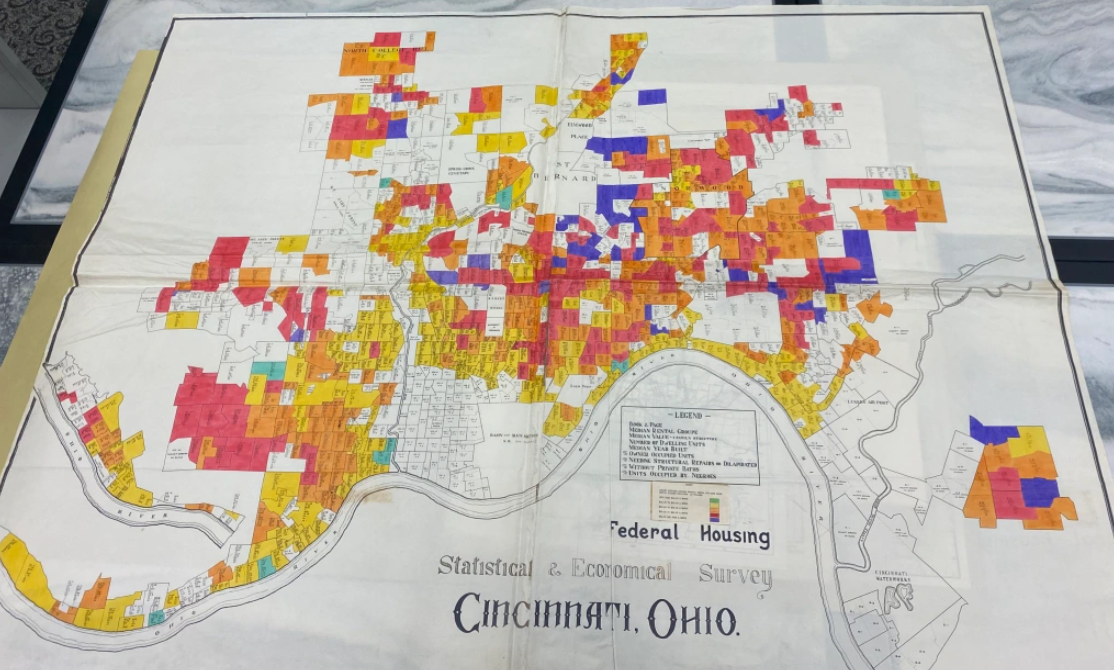
As part of our wide-ranging reporting over the last year, we dug into digital representations of life in Baltimore, analyzing housing data for the city, crime data, lead poisoning, banks locations and dozens of other things. We’re presenting a collection of these maps here to show how the “Black Butterfly,” named for the shape majority-Black neighborhoods take on a map, appears in seemingly unrelated data sets.
But why does the Black Butterfly keep appearing?
Lawrence T. Brown, a Morgan State University research scientist at the Center for Urban Health Equity who coined the term, said it’s a continuing effect of nearly a century of public policy in Baltimore.
In 1911, Baltimore implemented America’s first racial housing covenant with a law segregating Black residents into particular blocks of the city. And the Federal Housing Administration established a practice of denying loans and insurance to parts of the city where Black people were moving, known as redlining, in the 1930s. According to Brown, these efforts by public entities established the rubric for private banks’ disinvestment in Black neighborhoods and subsequent policies with racially disparate effects.
“Black neighborhoods became the sacrifice zones for the city of Baltimore. That was the unspoken policy. It still is the policy that ties it all together,” Brown said.
Written by: Nick Thieme and Ryan Little
